When the Market Breaks Its Own Rules
Something extraordinary is happening in the Bitcoin chart and it is not getting the attention it deserves.


The weekly RSI has just tagged a level that has only appeared at the most severe moments in the asset’s history. The 2018 bear market end. The Covid collapse. The eighteen thousand wick in 2022. All of them were final capitulations. All of them were the point where the market had wrung out every last drop of fear before turning the entire cycle around.
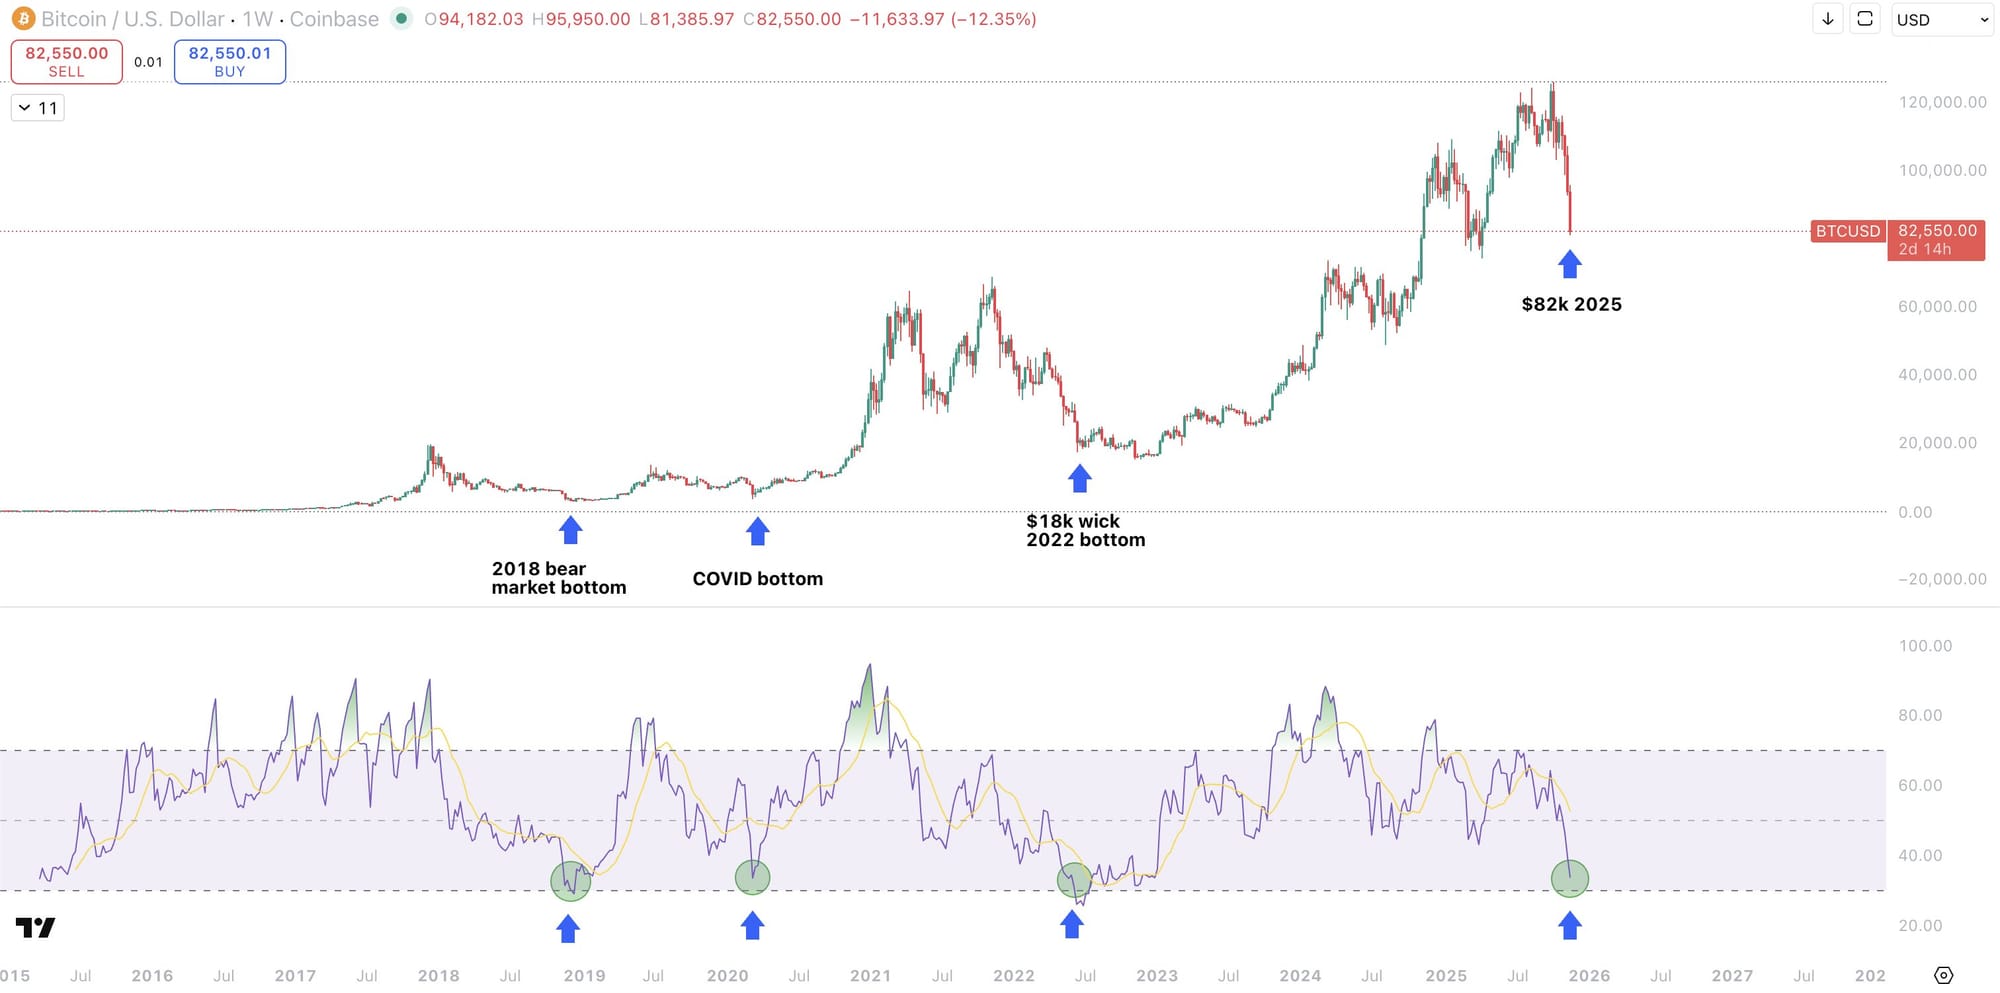
Today we are seeing that same signal but the context is completely different. Price is not in the gutter. Price is not broken. Bitcoin is sitting at eighty two thousand inside a high timeframe structure that has not been violated. This creates a kind of distortion that you do not see in normal cycles. It is the behaviour of a market that has crossed into a new regime. ETFs. Sovereign buyers. Derivatives thick with leverage. Stablecoin rotation on a scale that never existed in previous eras. The capital flow surrounding Bitcoin has evolved but the indicators have not evolved with it. The result is an RSI reading that looks like a full collapse in a context that looks like a mid trend correction.
This is why the chart feels so surreal. You are watching a bear market exhaustion signal emerging inside a bull trend. Historically this type of RSI reading has always been followed by sharp reversals and violent rallies. The difference now is that there is no pit to climb out from. When a capitulation signal appears this high in the structure it does not act as a rescue. It acts as an accelerant.
There is no precedent for this configuration. The old patterns do not fit because Bitcoin is no longer the asset it was when those patterns formed. All we can say with confidence is that markets do not compress like this without a release. And the release that follows is rarely small. Something significant is loading beneath the surface and the RSI is the first indicator to flinch.
V.